Leaflet Baidu Map
How to display baidu map on leaflet.js framework? This project show the baidu map on leaflet.js.

In this laboratory there are many big data analysis application demos on web map. We used a lot of opensource tools, for example Leaflet.js Turf.js D3.js ...
How to display baidu map on leaflet.js framework? This project show the baidu map on leaflet.js.
This project demo implemented super cluster for big data markers on baidu map.
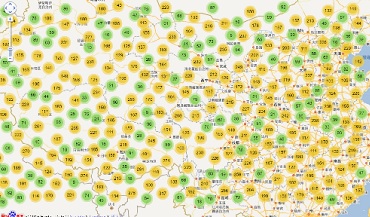
Use 'voronoi' function of D3.js to visualize and analysis real-time air quality index (AQI) on leaflet map.
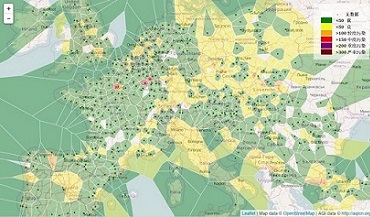
Visualize the AQI to triangulated irregular network on leaflet map by 'tin' function of Turj.js.
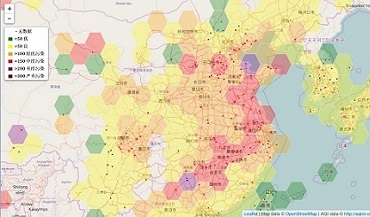
Use hexagon to analysis the AQI on map by 'hexGrid' function of Turf.js.
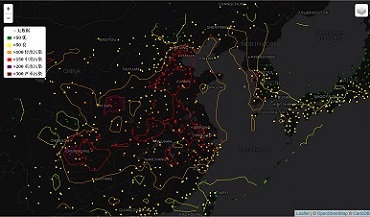
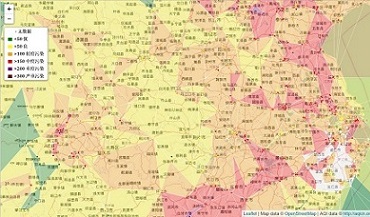
Use isolines to analysis the AQI on map by 'isolines' function of Turf.js.
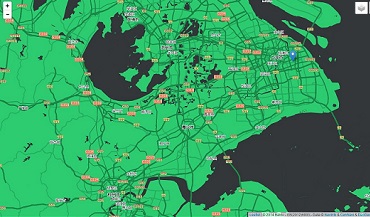
This project show how to display baidu map on Leaflet.js.
详细教程参考Use Baidu Map Provider in Leaflet.js
This project demo implemented super cluster for big data markers on baidu map.
详细教程参考Super-cluster plugin on Baidu Map
详细教程参考Analysis of AQI on Map using D3.js and Turf.js
如果你有更好的方法,欢迎联系我。
If you are interesting in those web visualization, please send message to me.