Zoomable sequence sunburst of D3.js
Zoomable sequence sunburst of D3.js

D3.js is a JavaScript library for manipulating documents based on data. D3 helps you bring data to life using HTML, SVG, and CSS. D3’s emphasis on web standards gives you the full capabilities of modern browsers without tying yourself to a proprietary framework, combining powerful visualization components and a data-driven approach to DOM manipulation.
Zoomable sequence sunburst of D3.js

C3 makes it easy to generate D3-based charts by wrapping the code required to construct the entire chart. We don't need to write D3 code any more.
We used C3.js that is a reusable chart library based D3.js.
Import two libraries
<link href="//cdnjs.tiven.wang/ajax/libs/c3/0.4.11/c3.css" rel="stylesheet" type="text/css">

<script src="//cdnjs.tiven.wang/ajax/libs/d3/3.5.17/d3.min.js" charset="utf-8"></script>
<script src="//cdnjs.tiven.wang/ajax/libs/c3/0.4.11/c3.js"></script>
The simple JavaScript code
var chart = c3.generate({
        data: {
          columns: [
            ['data1', 30, 200, 100, 400],
            ['data2', 50, 20,  10,  40]
          ],
          type: 'bar',
          selection: {
            enabled: true
          },
          onclick: function (d, element) {
            chart.transform('line');
          }
        },
        axis: {
          rotated: true,
        },
        zoom: {
          enabled: true
        }
      });
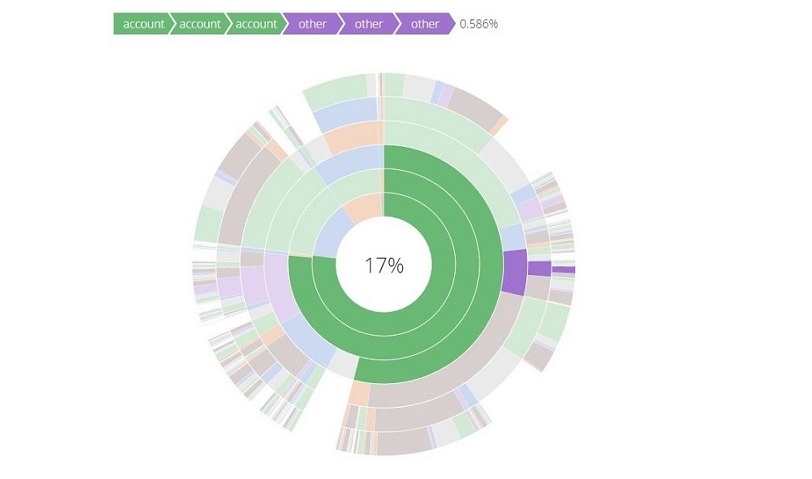
We created a zoomable sequence sunburst used D3.js.
var colors = {
          "home": "#5687d1",
          "product": "#7b615c",
          "search": "#de783b",
          "account": "#6ab975",
          "other": "#a173d1",
          "end": "#bbbbbb"
        };

var zSeqSunburst = new ZoomSequenceSunburst("#chart", {
//  depth: 3,
    innerHeigh: 2,
    width: 750,
    height: 600,
    breadCrumb: {
      w: 75, h: 30, s: 3, t: 10
    }
  })
  .fill(function(d) {
    return colors[d.data.name];
  })
// .breadcrumbText(function(d) {
//    return d.value;
// })
  ;

  // Use d3.text and d3.csv.parseRows so that we do not need to have a header
  // row, and can receive the csv as an array of arrays.
  d3.text("visit-sequences.csv", function(text) {
    var csv = d3.csvParseRows(text);
    var json = buildHierarchy(csv);
    zSeqSunburst.create(json);
  });
If you are interesting in those web visualization, please send message to me.